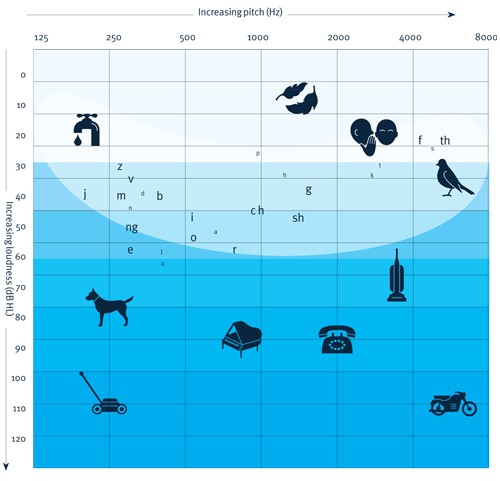
The audiogram is a graphical display of the hearing test. The two main components that are graphed are frequency and intensity. These results are displayed for each ear. When you had your hearing tested, the hearing aid practitioner was determining the softest sound you could hear at each specific frequency.
Frequency (or pitch) is measured in Hertz (Hz). Frequencies range from low-pitch to high-pitch and read from left to right on the audiogram. Each vertical line represents a different frequency. The ones used most often during testing are 250, 500, 1000, 2000, 3000, 4000 and 8000 Hz.
Intensity is measured in decibels (dB). The intensity relates to how loud or soft a sound is. Each horizontal line represents a different intensity level. The softest sounds are at the top of the chart and the loudest sounds at the bottom. Each mark on an individual’s hearing test would represent the softest sounds they could hear. The softest intensity tested is typically 0 dB and the loudest is 120 dB.
Right Ear – Left Ear: The right ear is graphed with either a circle or triangle. The left ear is graphed with an X or a square. These responses would all represent the air conduction results of either the right or left ear.
Other symbols seen on the audiogram are obtained during bone conduction testing. The right ear is graphed with < or [. The left ear with > or ]. These responses can help determine whether a hearing loss is sensorineural or conductive.
Speech Testing: Speech discrimination or word recognition ability is scored as a percentage. This score represents how well a list of words could be repeated. The words are presented at a comfortable volume level with no background noise present.
Degrees of Hearing Loss: Hearing loss is classified in degrees of hearing from normal to profound. This classification is determined by the hearing threshold (or the softest a sound was heard at a specific frequency).


